Data Ingestion
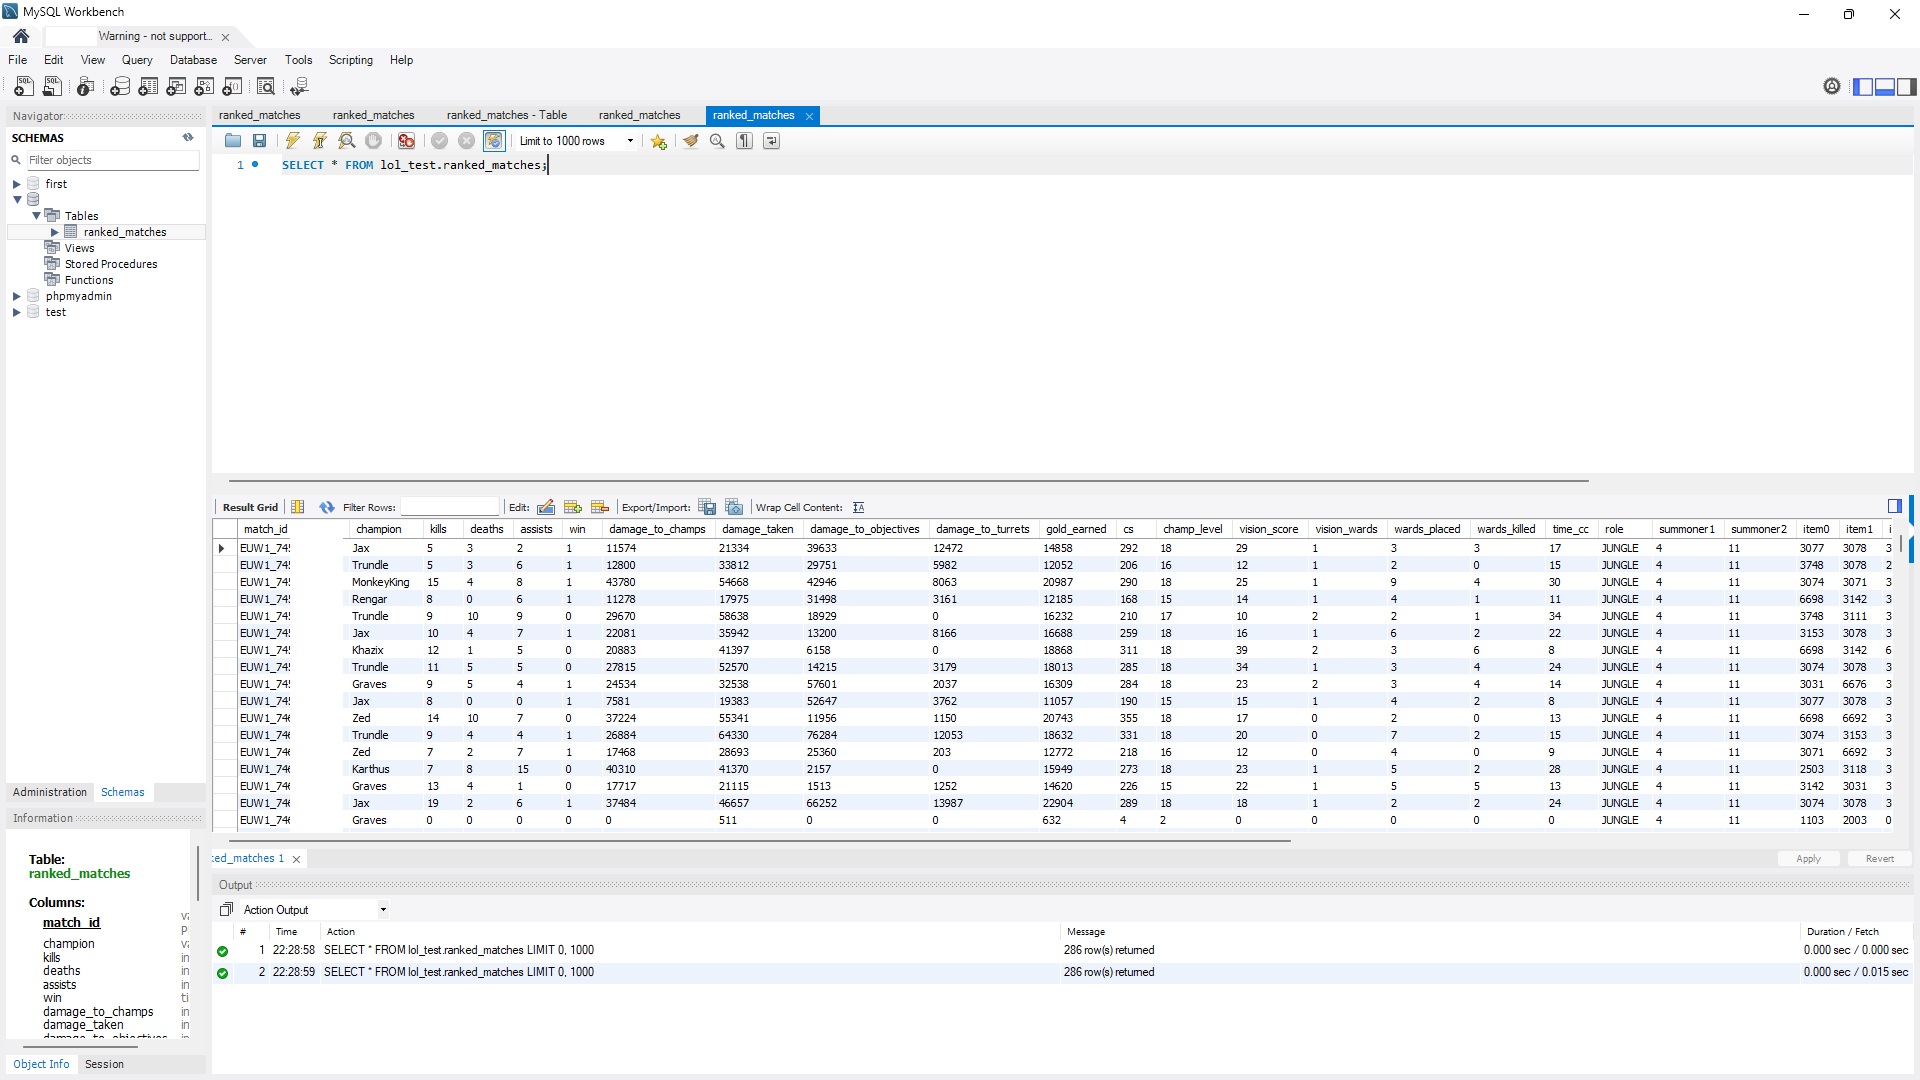

Screenshot of the raw data stored in MySQL.
Data analysis on ranked matches: which factors lead to victory?
286 matches · EUW region · Ranked Solo/Duo · Collected via Riot Games API
This project analyzes ranked match data to identify which performance metrics most strongly influence game outcomes. Data is collected using Python (Riot Games API requests), stored in MySQL, and later processed for analysis and visualization.
Key variables include Kills, Deaths, Assists, CS, and Gold Earned. The objective is to translate in-game performance indicators into a data-driven attribution framework, highlighting which factors contribute most significantly to winning matches.
This project demonstrates how performance drivers can be identified through structured data analysis. By comparing winning and losing outcomes, it is possible to isolate high-impact variables and reduce noise.
The same analytical framework can be applied in business environments:
Note: Dataset exported from the Riot API and stored in MySQL; sample rows are shown in the "Sample Data Table" screenshots above.
Screenshot of the raw data stored in MySQL.
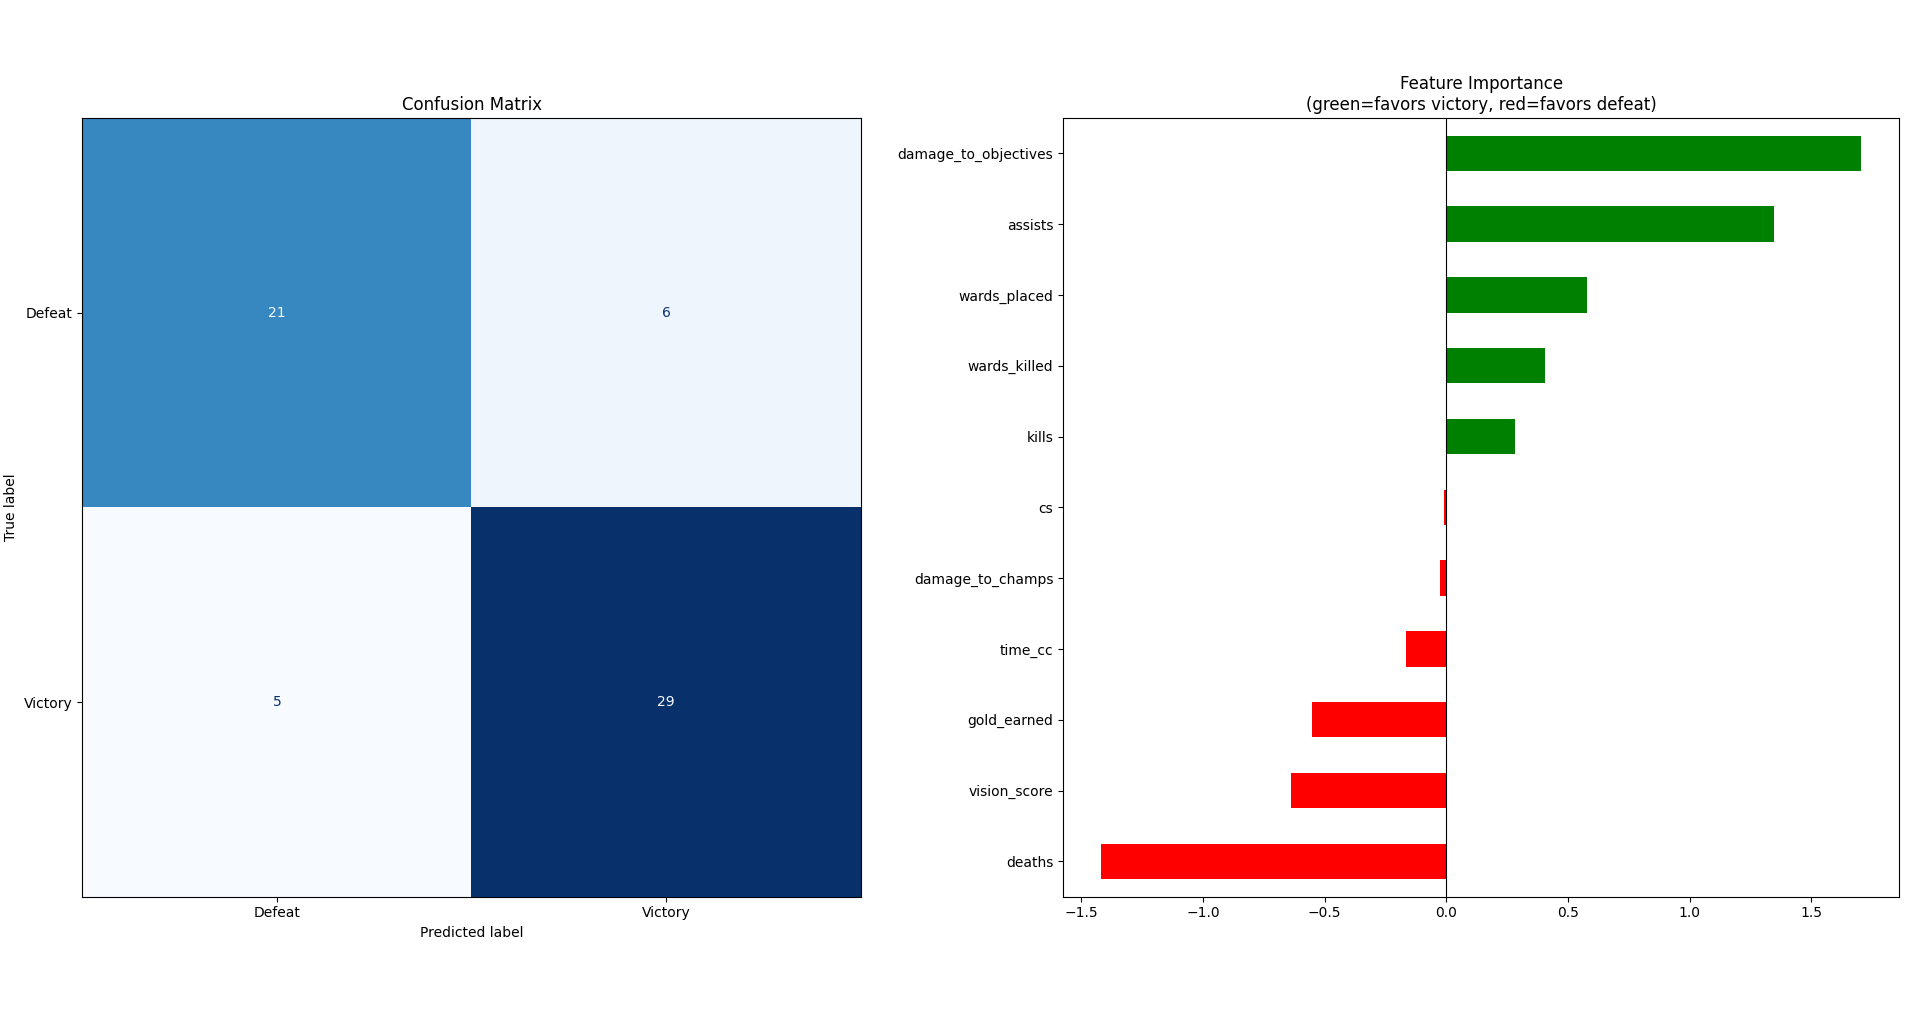
Reading the Confusion Matrix
The model was evaluated on 61 matches (test set). 21 defeats and 29 victories were correctly predicted, yielding an overall accuracy of ~82%. There were 6 false positives (defeats predicted as victories) and 5 false negatives (victories predicted as defeats) — a balanced error distribution, suggesting the model is not biased toward either outcome.
Reading the Feature Importance
The bar chart shows each feature's coefficient in the model (green = favors victory, red = favors defeat).
Top victory drivers: damage_to_objectives (~1.65) is the single strongest win predictor — directly tied to tower and dragon priority. Assists (~1.35) rank second, confirming that team-oriented play matters far more than solo output. Wards placed and wards killed follow, highlighting that vision control is a meaningful competitive differentiator.
Top defeat drivers: Deaths (~−1.5) is overwhelmingly the strongest negative feature — dying costs gold, tempo, and map pressure simultaneously. vision_score and gold_earned also appear negative, likely reflecting a multicollinearity effect: in losing games, players farm more passively without translating gold into objectives.
CS and damage_to_champs sit near zero — reinforcing the core finding: individual combat and farming statistics are poor predictors of match outcome compared to objective-focused teamplay.
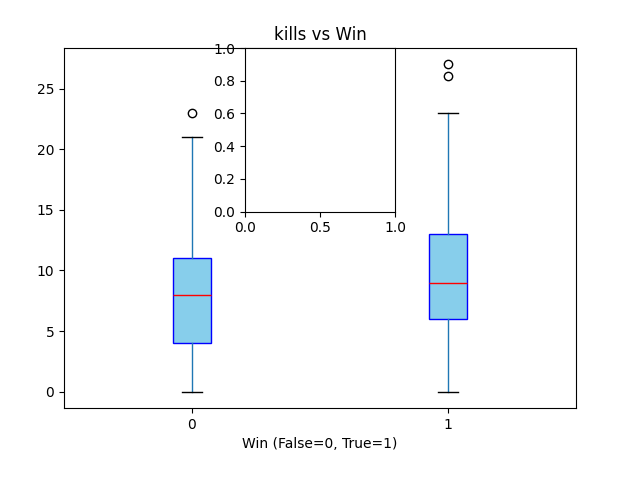
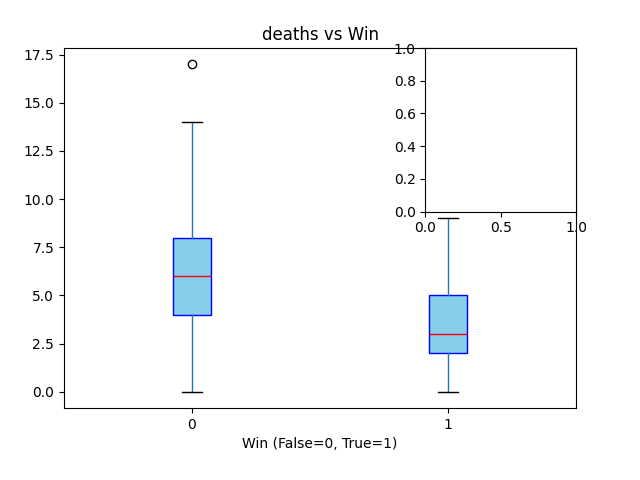
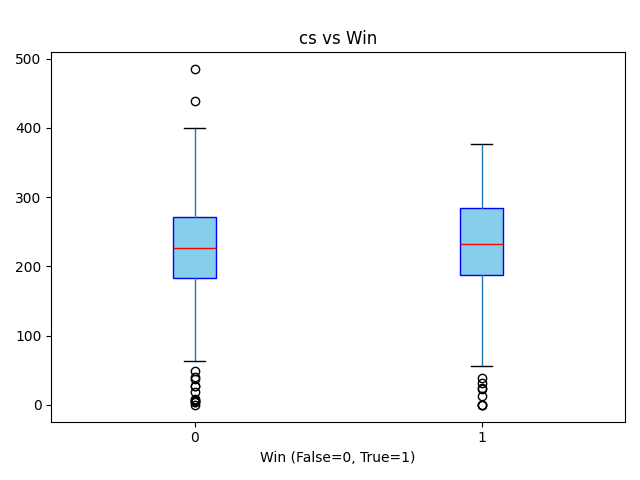
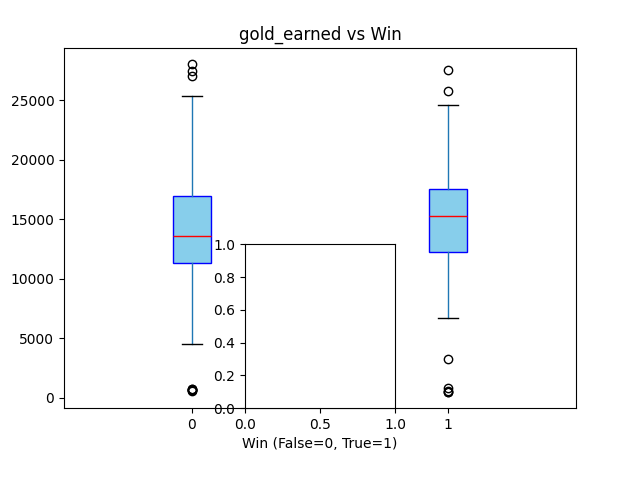
The boxplots above show how key metrics (Kills, Deaths, Assists, CS, Gold) differ between winning and losing matches.
Correlation with Victory
Pearson coefficient — positive = win factor, negative = loss factor
Avg Kills · Win vs Loss
Avg Deaths · Win vs Loss
The analysis reveals that commonly assumed performance indicators do not always translate into victory. Kills and CS (creep score), often perceived as primary success metrics, show surprisingly weak predictive power.
Instead, the strongest predictors of victory are towers destroyed and dragons secured — both inherently team-oriented objectives — suggesting that coordinated, objective-focused play outweighs individual performance. On the negative side, deaths is the single most significant factor associated with defeat, more so than any offensive metric.
This mirrors a fundamental principle applicable beyond gaming: individual output metrics (kills, CS) are less reliable performance indicators than process and collaboration metrics (objectives, assists). A framework built around the right KPIs leads to better outcomes than one optimized for vanity metrics.